BitcoinWorld Emerging Markets Equities Lead Uneven Holdings Recovery, BNY Report Reveals Surprising Trends A new report from BNY reveals that emerging markets equities are spearheading an uneven global holdings recovery in early 2025. The analysis, based on custody data from the bank, shows a clear divergence between developing and developed economies. This trend marks a significant shift in investor sentiment after a period of global uncertainty. BNY’s findings suggest that capital flows are returning, but not uniformly across all regions. BNY Report Highlights Uneven Recovery in Equities Holdings The BNY report, released this week from their New York headquarters, indicates that emerging markets equities have seen the strongest inflow momentum since the start of the year. Specifically, holdings in Asian and Latin American markets have rebounded sharply. Meanwhile, developed market equities, particularly in Europe and the United States, show a more tepid recovery. This uneven pattern challenges the typical ‘risk-on, risk-off’ narrative that often governs global capital flows. According to the data, investor holdings in emerging market equities increased by over 8% in the first quarter of 2025. In contrast, developed market holdings grew by only 2.5% during the same period. This divergence is attributed to several factors, including lower valuations in emerging markets and a search for higher yields. The report uses proprietary data from BNY’s asset servicing arm, which tracks over $2 trillion in assets under custody. Key Factors Driving the Emerging Markets Surge Several structural factors are driving this recovery. First, many emerging market central banks have begun cutting interest rates ahead of their developed counterparts. This monetary easing has made local currency bonds and equities more attractive. Second, commodity-exporting nations have benefited from stable prices, boosting their fiscal positions. Finally, geopolitical shifts have led to a diversification of supply chains, benefiting countries like India, Vietnam, and Brazil. Furthermore, the BNY report notes that institutional investors are rebalancing their portfolios. Pension funds and sovereign wealth funds are increasing their allocations to emerging markets equities . This is a long-term trend that predates the current recovery cycle. The report suggests this is not a short-term speculative move but a strategic adjustment. Developed Markets Lag in the Global Recovery In contrast, developed markets face headwinds that are slowing their recovery. The United States equity market, for example, is grappling with high valuations and uncertainty around fiscal policy. European equities are weighed down by a sluggish manufacturing sector and energy transition costs. Japanese equities, while initially strong, have faced volatility due to currency fluctuations. The BNY data shows that holdings in US equities have only recently stabilized after a period of outflows. European equity holdings remain below their 2023 peaks. This creates a stark contrast with the robust inflows seen in emerging markets. The report emphasizes that this is a ‘holdings recovery’ rather than a ‘flow recovery,’ meaning existing investors are increasing their positions rather than new money entering the market. Impact of Currency Movements on Equities Holdings Currency movements play a crucial role in this recovery. The US dollar has weakened slightly against a basket of emerging market currencies in 2025. This makes dollar-denominated returns from emerging markets even more attractive. Conversely, a strong yen has hurt Japanese equity returns for foreign investors. The BNY report adjusts for currency effects to provide a clearer picture of underlying holdings trends. For instance, when measured in local currency terms, emerging market equity returns have outpaced developed markets by a margin of 12% to 4% year-to-date. This performance gap is a key driver of the holdings recovery. Investors are voting with their feet, moving capital toward regions with better growth prospects and more attractive valuations. Expert Analysis: What This Means for Investors Market analysts view the BNY report as a credible signal of changing investor behavior. “The data confirms what many have suspected: the recovery is real but concentrated,” says a senior strategist at a global asset manager. “Investors are not simply buying the broad market. They are being selective, favoring regions with strong fundamentals.” This selective approach is a hallmark of a mature recovery phase. The report also highlights the role of passive versus active investing. Passive flows into emerging market ETFs have accelerated, while active managers are also increasing their overweight positions. This dual demand is creating a powerful tailwind for emerging markets equities . The BNY data suggests this trend could continue if macroeconomic conditions remain supportive. Risks and Challenges to the Recovery Despite the positive outlook, the BNY report cautions against complacency. The recovery remains uneven and could be derailed by several factors. A sudden spike in US interest rates could reverse capital flows back to developed markets. Geopolitical tensions, particularly in Eastern Europe and the Middle East, pose a constant risk. Additionally, some emerging markets face domestic political instability that could undermine investor confidence. Another risk is the concentration of inflows. A large portion of the recovery is driven by a handful of countries, including India, Brazil, and South Korea. If these markets experience a correction, the broader recovery could stall. The BNY report advises investors to diversify within the emerging market asset class to mitigate these risks. Timeline of the Equities Holdings Recovery The recovery has unfolded in distinct phases. In late 2024, early signs of stabilization appeared as inflation cooled globally. By January 2025, inflows into emerging market equities began to pick up momentum. February saw a sharp acceleration, with weekly inflows reaching multi-year highs. March and April have confirmed the trend, though with some volatility. The BNY report provides a granular breakdown by region. Asian equities have led the recovery, accounting for 60% of total inflows. Latin American equities have also performed well, driven by commodity exports. In contrast, European emerging markets, such as Poland and Hungary, have seen more modest gains. This regional variation underscores the uneven nature of the recovery. Conclusion The BNY report clearly demonstrates that emerging markets equities are leading an uneven but significant holdings recovery in 2025. While developed markets lag, the shift in capital flows signals a changing global investment landscape. Investors are responding to lower valuations, higher growth potential, and supportive monetary policies in developing economies. However, risks remain, and the recovery’s sustainability depends on global macroeconomic stability. For now, the data points to a decisive turn toward emerging markets as a key driver of portfolio returns. FAQs Q1: What is the main finding of the BNY report on equities holdings recovery? The BNY report finds that emerging markets equities are leading an uneven global recovery in holdings, with developed markets lagging behind. The data shows stronger inflows and higher growth in holdings for emerging markets compared to developed ones. Q2: Why are emerging markets equities outperforming developed markets in this recovery? Several factors drive this outperformance, including lower valuations, earlier interest rate cuts by emerging market central banks, stable commodity prices, and strategic portfolio rebalancing by institutional investors toward regions with higher growth potential. Q3: How does the BNY report measure equities holdings? The report uses proprietary custody data from BNY’s asset servicing arm, which tracks over $2 trillion in assets under custody. It measures changes in investor holdings, adjusting for currency effects to provide an accurate picture of underlying capital flows. Q4: Which emerging market regions are leading the recovery? Asian equities, particularly in India, Vietnam, and South Korea, lead the recovery, accounting for about 60% of total inflows. Latin American markets, such as Brazil, also show strong performance. European emerging markets have seen more modest gains. Q5: What are the main risks to the emerging markets equities recovery? Key risks include a sudden spike in US interest rates, geopolitical tensions, domestic political instability in some emerging markets, and the concentration of inflows in a few countries. A correction in leading markets could stall the broader recovery. Q6: Is this recovery expected to continue for the rest of 2025? The BNY report suggests the trend could continue if macroeconomic conditions remain supportive, such as stable global growth and continued monetary easing in emerging markets. However, the report advises caution due to the uneven nature of the recovery and potential external shocks. This post Emerging Markets Equities Lead Uneven Holdings Recovery, BNY Report Reveals Surprising Trends first appeared on BitcoinWorld .
Bitcoin World 2026-04-22 11:45
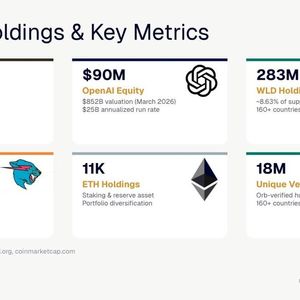
Eightco treasury composition as of April 20, 2026: $90M OpenAI equity, $25M Beast Industries equity, 11,068 ETH, 283 million WLD holdings, and $118M cash and equivalents World solves the 'double human' problem in a world proliferating with deep fakes and agentic agents World and Tools For Humanity (TFH) unveil new features at World Lift Off Event, expanding 'Proof of Human' to include Face Auth, Deep Face and Credentials and Concert Kit World announces new implementations of these features with Zoom, Docusign, Tinder, Browserbase, Exa, Okta, and Vercel World also introduces AgentKit, a developer toolkit designed to provide cryptographic proof that an AI agent is operated by a verified, unique human. Eightco offers public market access to the most innovative private companies including OpenAI and Beast Industries EASTON, Pa., April 21, 2026 /PRNewswire/ -- Eightco Holdings Inc. (NASDAQ: ORBS) ("Eightco" or "the Company") today provided an update on its total holdings, highlighting its expanding position across digital assets and strategic investments in leading private technology companies. As of April 20, 2026, at 5:00 p.m. ET, ORBS' holdings include a $90 million investment in OpenAI, a $25 million investment in Beast Industries, 283,452,700 Worldcoin (WLD) at $0.27 per WLD (per Coinbase), 11,068 Ethereum (ETH coins), and $118 million in total cash and stablecoins, for total holdings of approximately $336 million. The World Lift Off event took place on April 17th and many products and new features were unveiled. Among the key new announcements: World ID protocol updates New partners : Zoom, Docusign, Tinder, Browserbase, Exa, Okta, and Vercel New features in addition to Proof of Human, Face Auth, Deep Face and Credentials and Concert Kit These bring proof of human to more platforms where people connect, work, and play Expanded use cases: From deepfake protection to bot‑resistant governance The use case and need for World and Proof of Human is rising rapidly in 2026. "More than 50% of all things on the internet are now generated by AI," said Sam Altman, OpenAI Chief Executive Officer and Tools for Humanity co-founder, during the World Lift Off keynote on April 17, 2026. "Preventing 'double human,' is arguably the most central issue faced by the digital economy today," said Thomas "Tom" Lee, Chairman of Bitmine, Head of Research at Fundstrat, and Board Member of Eightco. "By being able to verify the authenticity of our interactions, the world can positively leverage increasingly powerful technologies while maintaining trust." "We can also avoid the most damaging risks from the rising capabilities of agent systems," continued Lee. "After all, one of the primary use cases of digital assets and blockchains was to prevent the problem of 'double spend' and now Proof of Human prevents 'double human.'" Notably, World and TFH also unveiled AgentKit. This developer toolkit is designed to provide cryptographic proof that an AI agent is operated by a verified, unique human. In other words, as the agent economy grows, AgentKit provides a trust layer, by ensuring this agent has been designated by a verified and unique person. Eightco is built around three mega-trends the company expects to shape the next decade of innovation, including: artificial intelligence, digital identity, and the creator economy, with direct positions in each through OpenAI (27% of ORBS balance sheet), Worldcoin (23%), and Beast Industries (7%). Digital Identity — WLD Token Eightco holds over 283 million WLD, approximately 9% of circulating supply, the largest publicly disclosed institutional position, and representing approximately 23% of the Eightco treasury. Bots and automated traffic now account for roughly 58% of global web requests, officially tipping into the majority and climbing fast in 2026 as agents proliferate. With bots outnumbering humans online, proof-of-human is quickly becoming essential infrastructure. Worldcoin is the native token of World , a global Proof of Human network built by Tools for Humanity (co-founded by Sam Altman and Alex Blania) and stewarded by the World Foundation. Its Orb device issues a privacy-preserving World ID that verifies a user is a unique human, not an AI agent. Artificial Intelligence — OpenAI Eightco holds $90 million of OpenAI equity, representing approximately 27% of the treasury assets, one of the highest disclosed OpenAI concentrations of any listed vehicle. ChatGPT, OpenAI's consumer app, has officially claimed the #1 spot in consumer AI, overtaking TikTok, Instagram, and Facebook in monthly worldwide downloads in early 2026 (Sensor Tower), making it the fastest-scaling consumer app of the year. Creator Economy — Beast Industries Eightco holds $18 million of Beast Industries equity with an additional $7 million future commitment, or $25 million total, approximately 7% of the treasury assets. Beast Industries became the first creator-led company to cross a $5.2 billion private valuation, with a 500M+ combined follower base across platforms. As AI commoditizes content creation, distribution and audience trust become scarce assets, Beast Industries commands one of the largest direct-to-consumer reach footprints in the world. About Eightco Holdings Inc. Eightco Holdings Inc. (NASDAQ: ORBS) is a publicly traded holding company executing a first-of-its-kind Worldcoin (WLD) treasury strategy, offering investors single-ticker exposure to three of the defining trends of this cycle: artificial intelligence through its pre-IPO equity stake in OpenAI , digital identity through its position as the largest public holder of WLD and the Proof-of-Human protocol, and the creator economy through its equity stake in MrBeast's Beast Industries. Backed by leading institutional investors including Bitmine Immersion (NYSE: BMNR), ARK Invest, and Payward/Kraken, Eightco is building the infrastructure layer for human verification in the agentic AI era. For more information: X: @iamhuman_orbs Website: 8co.holdings Frequently Asked Questions What is ORBS stock? Eightco Holdings Inc. (NASDAQ: ORBS) is a publicly traded holding company on Nasdaq. ORBS provides single-ticker exposure to three private-market positions: Worldcoin (WLD), the token of World (a project of Tools for Humanity ); OpenAI ; and Beast Industries . Who owns the most Worldcoin (WLD)? Eightco Holdings (NASDAQ: ORBS) holds over 283 million WLD, approximately 9% of circulating supply and the largest publicly disclosed institutional position. What is Proof-of-Human? Proof of Human is cryptographic verification that a user is a unique, living person, not a bot or AI agent. It is foundational infrastructure for social networks, banking, and any system requiring "one person, one account" in the agentic AI era. How does Eightco (ORBS) relate to Proof of Human? Eightco Holdings (NASDAQ: ORBS) is the largest publicly disclosed institutional holder of Worldcoin (WLD), the token powering World's Proof of Human network, with over 283 million WLD (~9% of circulating supply). Who are investors in Eightco Holdings (ORBS)? Eightco's investors include Bitmine Immersion Technologies (NYSE: BMNR), MOZAYYX, World Foundation, Wedbush, CoinFund, Discovery Capital Management, FalconX, Payward/Kraken, Pantera, and GSR. Who is the CEO of Eightco Holdings? Kevin O'Donnell is the CEO of Eightco Holdings (NASDAQ: ORBS). The Company's Board includes Tom Lee (Managing Partner and Head of Research at Fundstrat, and Chairman of Bitmine Immersion Technologies (NYSE: BMNR)) and, as an advisor to the Board, Brett Winton (Chief Futurist at ARK Invest). Forward-Looking Statements This press release contains forward-looking statements within the meaning of the Private Securities Litigation Reform Act of 1995. All statements in this press release other than statements of historical fact could be deemed forward looking, including, without limitation, statements regarding: expectations regarding the World Lift Off event; the Company's expectations that artificial intelligence, digital identity, and the creator economy will shape the next decade of innovation; beliefs that Proof-of-Human verification is becoming essential infrastructure for social networks, banking, and financial systems in the agentic AI era; the Company's treasury strategy and anticipated benefits of its positions in WLD, OpenAI, and Beast Industries; and statements regarding the Company's future capital commitments and investment plans. Words such as "plans," "expects," "will," "anticipates," "continue," "expand," "advance," "develop" "believes," "guidance," "target," "may," "remain," "project," "outlook," "intend," "estimate," "could," "should," and other words and terms of similar meaning and expression are intended to identify forward-looking statements, although not all forward-looking statements contain such terms. Forward-looking statements are based on management's current beliefs and assumptions that are subject to risks and uncertainties and are not guarantees of future performance. Actual results could differ materially from those contained in any forward-looking statement as a result of various factors, including, without limitation: the Company's inability to direct the management or operations of private businesses where the Company is not a controlling stockholder; risk of loss or markdown on the Company's strategic investments, including its positions in WLD, OpenAI equity, and Beast Industries equity; the Company's ability to maintain compliance with the Nasdaq's continued listing requirements; unexpected costs, charges or expenses that reduce the Company's capital resources or otherwise delay capital deployment; inability to raise adequate capital to fund or scale its business operations or strategic investments; volatility in digital asset prices, including WLD and ETH, which could materially affect the value of the Company's treasury holdings; regulatory changes, future legislation and rulemaking negatively impacting digital assets or artificial intelligence adoption; risks related to the development, adoption, and market acceptance of Proof-of-Human technology and the World network; uncertainty regarding the success of the World Lift Off event and its impact on WLD value or adoption; and shifting public and governmental positions on digital assets or artificial intelligence-related industries. Given these risks and uncertainties, you are cautioned not to place undue reliance on such forward-looking statements. For a discussion of other risks and uncertainties, and other important factors, any of which could cause Eightco's actual results to differ from those contained in the forward-looking statements herein, see Eightco's filings with the Securities and Exchange Commission (the "SEC"), including the risk factors and other disclosures in its Annual Report on Form 10-K filed with the SEC on April 15, 2026 and other publicly available SEC filings. All information in this press release is as of the date of the release, and Eightco undertakes no duty to update this information or to publicly announce the results of any revisions to any of such statements to reflect future events or developments, except as required by law. Disclaimer: This is a sponsored press release and is for informational purposes only. It does not reflect the views of Bitzo, nor is it intended to be used as legal, tax, investment, or financial advice.
Bitzo 2026-04-22 11:42
This year, we issued over 56 million Form 1099-DAs (tax form required for reporting digital asset transactions) to the IRS, one for every reportable transaction our customers made in 2025. That is what the law requires even though nearly a third of those forms (18.5 million) were for transactions worth less than $1. Over half were for $10 or less. Three out of every four were for less than $50. These forms were not sent to sophisticated traders who made big returns from crypto. The vast majority of the forms are for staking rewards measured in fractions of a cent, small purchases, and routine activity. Every single one generates a form that a real person is now expected to understand, reconcile, and report, or risk an IRS notice. The problem is not the technology. It’s the tax code. What it already costs Americans to file their taxes Before digital assets enter the picture, the tax system already imposes an extraordinary compliance burden. According to the Tax Foundation, individual tax returns alone cost Americans a combined $146 billion in time and out-of-pocket expenses . Additionally, based on IRS estimates and independent filer surveys, the average non-business filer spends about eight hours and between $128 and $300 on a standard return. Nearly one in five Americans say they do not feel prepared to file. For the more than 55 million U.S. adults who now hold digital assets, there is an additional layer. Standard tax software does not handle crypto transactions, so many investors need dedicated crypto tax tools that cost $49 to $599 per year on top of their regular filing costs. A typical active holder can spend $250 to $500 annually just to stay compliant, before counting the hours spent reconciling transactions across exchanges and wallets. But here is where it gets even harder for the average taxpayer. In 2025, brokers like Kraken report gross proceeds but not cost basis . While many taxpayers were reporting crypto taxes using tax calculators or other software, Form 1099-DA just caused taxpayers a lot of confusion as the forms presented only gross proceeds in a way many did not understand. We received thousands of questions from clients trying to understand the Forms 1099-DA, in addition to thousands more inquiries given the difficulties for exchanges to produce these on the timeline laid out by the IRS and Treasury. The scale of the problem: Kraken’s 1099-DA data Here is what Kraken’s own reporting data shows for the 2025 tax year: 53.4% of all forms were for transactions of $10 or less. 74.3% were under $50. Only 8.5% exceeded $600, the threshold that triggers reporting in most other areas of the tax code such as transactions on a payment app like Venmo. The hours taxpayers spend reconciling these micro-transactions, often with incomplete data, generate costs wildly disproportionate to any revenue the IRS will collect from them. The good news is that some in Congress are working to address this. Any tax reform that simplifies life for taxpayers should address these core issues. Fix One: a real de minimis exemption The concept is simple: a de minimis exemption that excludes small, routine digital asset payments from capital gains reporting. Imagine you walk into a Steak ’n Shake and pay for a $7.99 meal with Bitcoin through a payment app. You have triggered a taxable event. You are technically required to look up the cost basis of the specific Bitcoin you spent, calculate whether you had a gain or loss on that fraction of a coin, and report it on Form 8949. All for a hamburger and some tallow fries. The US is an outlier in this respect. The UK, for instance, applies an annual capital gains allowance that effectively exempts small crypto transactions such as this from reporting. A targeted de minimis threshold wouldn’t be novel. It would just catch America up. And while current proposed tax legislation does include a de minimis provision, it only covers payment stablecoins. It does not cover Bitcoin, the most widely held digital asset in America, which is accepted by thousands of U.S. merchants. A meaningful de minimis threshold, indexed to inflation and paired with anti-abuse guardrails, would eliminate millions of unnecessary forms while protecting revenue integrity. Congress has already established the regulatory framework for mainstream digital payments through the GENIUS Act, signed into law in July 2025. The tax code should be agnostic whether you are paying with cash, Bitcoin or stablecoins. Fix Two: end phantom income from staking A large portion of those sub-dollar 1099-DAs are staking rewards: tiny fractions of tokens earned for helping validate blockchain networks. While the current law is unclear, the IRS takes the position that each reward is treated as ordinary income at the moment of receipt, valued at fair market value on that date. Most people do not sell staking rewards immediately. They keep staking. But they now owe taxes on value they have not realized. If the token price drops between receipt and filing, the taxpayer owes tax on more than the asset is currently worth. This is phantom income and it’s a consequence of applying rules written for dividends and wages to a fundamentally different kind of asset. Congress should allow taxpayers to choose when staking rewards are taxed: at the time of receipt (as today) or at the time of sale, when the gain or loss is real and measurable. This would eliminate phantom income, dramatically reduce the volume of micro-transaction reporting, and align staking with how most Americans actually experience it, as something they hold rather than something they spend. Kraken and other exchanges already maintain the transaction level data needed to support either reporting method. The infrastructure exists; Congress simply needs to authorize the choice. A bipartisan moment for taxpayers This is not about helping crypto companies. It is about 55 million Americans, spanning every state, age bracket, and industry, who are navigating a tax system designed before digital assets existed. Congress should act to make taxpayers’ lives easier. Learn more about Policy at Payward The post We issued 56 million tax forms for 2025. Most were under $50. It’s time to fix digital asset taxes. appeared first on Kraken Blog .
Kraken Blog 2026-04-22 11:42
BitcoinWorld AUD/JPY Holds Gains Above 114.00 as US Strait Blockade Easing Sparks Risk-On Rally The AUD/JPY currency pair continues to hold gains above the key 114.00 level. This follows the announcement of an easing of the US Strait blockade. Traders now shift focus to risk-on sentiment. The move marks a significant shift in market dynamics. Investors react positively to the geopolitical development. This article provides a detailed analysis of the factors driving this trend. AUD/JPY Holds Gains Above 114.00: A Strategic Level The AUD/JPY pair has maintained its position above 114.00 for the second consecutive session. This level acts as a strong psychological support. Market participants view it as a bullish signal. The pair previously struggled below this threshold. Now, it shows renewed upward momentum. Traders closely monitor this zone for potential breakout opportunities. Several factors contribute to this strength. First, the easing of the US Strait blockade reduces geopolitical risk. Second, the Australian dollar benefits from improved trade prospects. Third, the Japanese yen weakens as safe-haven demand drops. These elements combine to push the pair higher. US Strait Blockade Easing: Impact on Forex Markets The US Strait blockade easing news came early this week. Officials confirmed a phased reduction in naval restrictions. This move aims to de-escalate tensions in the region. Markets immediately responded with a surge in risk appetite. The Australian dollar gained 0.8% against the yen within hours. Geopolitical events often drive currency movements. The Strait is a critical shipping route for global trade. Its blockade threatened supply chains. The easing now restores confidence in trade flows. Consequently, the AUD/JPY pair reflects this optimism. Key Timeline of Events Day 1: Initial reports of blockade reduction emerge. AUD/JPY jumps from 113.50 to 114.20. Day 2: Official confirmation from US officials. Pair stabilizes above 114.00. Day 3: Asian markets open with strong buying interest. Pair tests 114.50 resistance. This timeline shows the rapid market adjustment. Traders now watch for further developments. Any reversal in policy could trigger a sharp decline. Risk-On Sentiment Drives Currency Pair Trends The easing news sparked a broader risk-on rally. Stock markets in Asia and the US rose. Commodity prices, including iron ore and coal, also gained. The Australian dollar, as a commodity-linked currency, benefits directly. The yen, typically a safe-haven, weakens in such environments. Data from the Reserve Bank of Australia shows increased export orders. This supports the AUD’s strength. Meanwhile, the Bank of Japan maintains its ultra-loose policy. This policy divergence further widens the gap between the two currencies. Market analysts at major banks now revise their forecasts. Many expect the AUD/JPY pair to test 115.00 in the coming weeks. However, they caution against over-optimism. The situation remains fluid. Technical Analysis: AUD/JPY Holds Gains Above Key Support From a technical perspective, the AUD/JPY pair shows a clear bullish structure. The 114.00 level now acts as strong support. The 50-day moving average sits at 113.80. This provides additional downside protection. The Relative Strength Index (RSI) reads 62, indicating room for further upside. Key resistance levels include: 114.50: Immediate resistance from last week’s high. 115.00: Psychological barrier and major resistance. 115.80: Year-to-date high from January. A break above 114.50 could trigger a move toward 115.00. Conversely, a drop below 113.80 would signal weakness. Traders should watch these levels closely. Expert Perspectives on the Forex Market Outlook Economists from leading financial institutions share their views. “The AUD/JPY holds gains above 114.00 because of genuine fundamental shifts,” says a senior analyst at a top investment bank. “The blockade easing removes a major risk premium. We now see fair value around 114.80.” Another expert from a currency research firm adds: “The yen’s weakness is structural. Japan’s monetary policy remains accommodative. The Australian economy benefits from China’s recovery. This combination supports the pair.” These expert opinions add credibility to the bullish outlook. However, they also highlight potential risks. Any escalation in trade disputes could reverse gains quickly. Comparative Analysis: AUD/JPY vs. Other Pairs The AUD/JPY pair outperforms other yen crosses this week. For comparison: Currency Pair Weekly Change Key Driver AUD/JPY +1.2% Blockade easing, risk-on NZD/JPY +0.8% Commodity price support GBP/JPY +0.5% UK economic data EUR/JPY +0.3% ECB policy expectations This table shows the AUD/JPY leads the pack. The Australian dollar’s sensitivity to geopolitical news drives this outperformance. Future Outlook: What to Watch for AUD/JPY Several factors will influence the pair’s direction. First, the US Strait situation remains a key variable. Any new restrictions could reverse gains. Second, Australian economic data due next week includes employment figures. Strong data would support the AUD. Third, Bank of Japan policy meetings in the coming months could shift yen dynamics. Traders should also monitor global risk sentiment. Equity market performance often correlates with AUD/JPY moves. A sustained rally in stocks would likely push the pair higher. Conversely, a risk-off event could trigger a sharp sell-off. Conclusion The AUD/JPY holds gains above 114.00 as the US Strait blockade easing reshapes market dynamics. This development boosts risk appetite and supports the Australian dollar. Technical indicators confirm a bullish trend. Expert analysis points to further upside potential. However, traders must remain vigilant. Geopolitical events can change quickly. The pair’s future depends on sustained positive sentiment and policy clarity. For now, the outlook remains constructive. FAQs Q1: Why did the AUD/JPY pair rise above 114.00? The rise follows news of the US Strait blockade easing. This reduces geopolitical risk and boosts risk-on sentiment. The Australian dollar gains, while the yen weakens as safe-haven demand drops. Q2: What is the significance of the 114.00 level for AUD/JPY? The 114.00 level acts as a psychological and technical support. Holding above it signals bullish momentum. A break below could indicate weakness and a potential reversal. Q3: How does the US Strait blockade affect forex markets? The blockade threatens global trade routes. Its easing restores confidence in supply chains. This reduces risk premiums and supports commodity-linked currencies like the Australian dollar. Q4: What are the key resistance levels for AUD/JPY? Key resistance levels include 114.50 (immediate), 115.00 (psychological), and 115.80 (year-to-date high). A break above these levels could signal further upside. Q5: Is the AUD/JPY rally sustainable? Sustainability depends on continued geopolitical stability and positive economic data. Expert analysis suggests room for further gains, but risks remain from policy changes or trade disputes. This post AUD/JPY Holds Gains Above 114.00 as US Strait Blockade Easing Sparks Risk-On Rally first appeared on BitcoinWorld .
Bitcoin World 2026-04-22 11:40
BitcoinWorld IRGC Warns of Obliterating US Remaining Assets in Middle East: Escalation Fears The Islamic Revolutionary Guard Corps (IRGC) has issued a stark warning, threatening to obliterate the United States’ remaining assets in the Middle East. This announcement, made through official channels, escalates an already volatile regional security environment. The statement directly targets US military installations, naval vessels, and strategic infrastructure across the region. This development demands immediate attention from global security analysts and policymakers. IRGC Warns US Assets in Middle East: The Official Statement The IRGC’s warning came through a formal communiqué on Monday. It explicitly names several key locations where US forces maintain a presence. The statement uses forceful language, promising a decisive and overwhelming response to any perceived aggression. This marks a significant shift in tone from previous diplomatic engagements. The IRGC frames this as a defensive measure to protect Iran’s national security interests. Key points from the IRGC statement include: Direct threat to US military bases in Qatar, Bahrain, and the United Arab Emirates. Warning about US naval assets in the Persian Gulf and the Strait of Hormuz. Assertion that Iran has the capability to target these assets with precision. Call for regional allies to distance themselves from US military operations. This rhetoric aligns with a pattern of escalating tensions between Tehran and Washington. The IRGC’s history of asymmetric warfare capabilities adds credibility to the threat. Regional governments now face a difficult balancing act between their security alliances and potential retaliation. Context: US Military Assets in the Middle East The United States maintains a substantial military footprint across the Middle East. This includes approximately 30,000 troops stationed in various countries. Key installations include Al Udeid Air Base in Qatar, Camp Arifjan in Kuwait, and Naval Support Activity Bahrain. These bases serve as critical hubs for air operations, logistics, and naval patrols. A breakdown of major US assets in the region: Country Key Base Primary Function Qatar Al Udeid Air Base Air operations, command center Bahrain NSA Bahrain Naval fleet support Kuwait Camp Arifjan Ground forces logistics UAE Al Dhafra Air Base Surveillance, refueling These assets are not just symbolic. They provide the US with rapid response capabilities for counterterrorism and deterrence missions. The IRGC’s warning targets the logistical and operational backbone of these forces. Any successful attack would severely degrade US power projection in the region. Escalation Timeline: From Diplomacy to Threats The current crisis did not emerge overnight. It follows a series of diplomatic failures and military confrontations. In early 2025, negotiations over Iran’s nuclear program collapsed. The US imposed new sanctions, which Iran called a violation of previous agreements. Subsequent proxy attacks on US bases in Iraq and Syria increased in frequency. Key events leading to this warning: January 2025: US drone strike kills an IRGC commander in Syria. March 2025: Iran seizes a commercial tanker in the Strait of Hormuz. April 2025: US deploys an additional aircraft carrier strike group to the region. May 2025: IRGC test-fires a new ballistic missile with a 2,000 km range. This timeline shows a clear pattern of reciprocal escalation. Each action by one side provokes a stronger response from the other. The IRGC’s latest warning represents a rhetorical red line. Crossing it could trigger a direct military confrontation. Expert Analysis: The Risk of Miscalculation Military analysts describe the current situation as extremely dangerous. Dr. Leila Hosseini, a security expert at the Institute for Regional Studies, notes that the IRGC’s doctrine emphasizes preemptive strikes. She states that the warning serves both a deterrent and a mobilizing purpose. It signals to domestic audiences that Iran will not back down. Simultaneously, it warns the US that any move will meet a swift response. Other experts highlight the role of non-state actors. Iran’s network of proxies, including Hezbollah and various Iraqi militias, could execute attacks without direct IRGC involvement. This provides a layer of plausible deniability. However, the IRGC’s explicit threat removes ambiguity. The US now must treat any attack on its assets as a potential casus belli. The risk of miscalculation is high. Both sides have limited channels for direct communication. The absence of a hotline or crisis management mechanism increases the chance of accidental escalation. A single drone incursion or naval incident could spiral into a wider conflict. Impact on Regional Security and Global Markets The IRGC’s warning has immediate and far-reaching consequences. Oil prices surged by 5% within hours of the statement. The Strait of Hormuz, a chokepoint for 20% of global oil supply, now faces heightened risk. Insurance premiums for tankers transiting the region have already doubled. Regional governments are scrambling to respond. Saudi Arabia and the UAE have called for de-escalation. They fear being caught in the crossfire of a US-Iran conflict. Their economies depend on stable energy markets and foreign investment. Any disruption would harm their Vision 2030 diversification plans. Key impacts include: Oil price volatility: Brent crude could spike above $120 per barrel. Shipping disruptions: Major shipping lines may reroute away from the Persian Gulf. Investment flight: Foreign capital may withdraw from Gulf stock markets. Humanitarian risk: Civilian populations near military bases face increased danger. The global community watches with concern. The United Nations Security Council has scheduled an emergency session. Diplomatic efforts by European and Asian powers aim to prevent a full-blown crisis. However, the IRGC’s uncompromising stance leaves little room for negotiation. Historical Parallels: Lessons from Past Conflicts This situation echoes previous US-Iran confrontations. The 1988 Operation Praying Mantis saw the US Navy destroy Iranian oil platforms and naval vessels. The 2019 attacks on Saudi Aramco facilities demonstrated Iran’s ability to strike critical infrastructure. The 2020 assassination of General Qasem Soleimani triggered a period of intense but contained retaliation. Each of these events followed a pattern of escalation and de-escalation. However, the current context differs in several ways. First, Iran’s missile and drone capabilities have advanced significantly. Second, the US has reduced its troop presence in the region, making remaining assets more vulnerable. Third, the breakdown of the JCPOA nuclear deal removes a key diplomatic framework. These differences suggest that the current crisis may not follow historical precedents. The IRGC’s warning could be a bluff, a negotiating tactic, or a genuine preparation for conflict. The US must interpret the signal correctly to avoid a costly war. Conclusion The IRGC’s warning to obliterate US remaining assets in the Middle East represents a serious escalation in an already tense region. This threat targets the logistical and operational backbone of American military power. The risk of miscalculation, combined with advanced Iranian capabilities, creates a volatile situation. Regional stability, global energy markets, and international security all hang in the balance. Diplomatic efforts must intensify to prevent a conflict that neither side can afford. The world now watches to see if words translate into action. FAQs Q1: What exactly did the IRGC warn about regarding US assets in the Middle East? The IRGC warned that it would obliterate US military assets in the Middle East, including bases in Qatar, Bahrain, and the UAE, as well as naval vessels in the Persian Gulf. The warning was issued as a response to perceived US aggression and sanctions. Q2: Which US military assets are most at risk from the IRGC threat? The most at-risk assets include Al Udeid Air Base in Qatar, Naval Support Activity Bahrain, Camp Arifjan in Kuwait, and Al Dhafra Air Base in the UAE. These bases host critical air, naval, and logistics operations. Q3: How has the US responded to the IRGC’s warning? The US has not issued an official response yet, but the Pentagon has heightened alert levels for its forces in the region. Diplomatic channels are active, with the US calling for de-escalation while maintaining its military posture. Q4: What are the potential global consequences if the IRGC follows through on its threat? A direct attack on US assets could trigger a major military conflict. Oil prices would spike, global shipping through the Strait of Hormuz would be disrupted, and regional economies would suffer. Humanitarian crises could also emerge near targeted bases. Q5: Is there any historical precedent for such a direct threat from the IRGC? While the IRGC has issued threats before, the explicit language targeting all US remaining assets is rare. Previous threats were more limited in scope. This warning represents a significant rhetorical escalation compared to past statements. This post IRGC Warns of Obliterating US Remaining Assets in Middle East: Escalation Fears first appeared on BitcoinWorld .
Bitcoin World 2026-04-22 11:35
The FOMC decision and Powell’s press conference land on April 29, the same evening that Microsoft, Alphabet, Meta, and Amazon all report. Q1 GDP, March PCE, and the Employment Cost Index follow the next morning. This is a stretch that rewards structured preparation. FOMC rate decision and press conference — April 29 The Federal Open Market Committee concludes its two-day meeting on April 29, with the policy statement due at 2:00 p.m. ET and Chair Powell’s press conference at 2:30 p.m. ET. The current target range sits at 3.50%–3.75%, and futures markets are pricing a hold as the overwhelmingly likely outcome. The decision itself is not the primary focus. What traders are watching is language. April is not a projections meeting; no dot plot, no updated Summary of Economic Projections. Which means every word in the statement carries more interpretive weight than usual. The Fed must communicate in an environment where headline inflation has risen on energy, core PCE remains above target, and Q4 2025 GDP came in at just 0.5%. The question the press conference will attempt to answer is whether the Committee treats the inflation overshoot as temporary or as a reason to hold rates higher for longer into the second half of 2026. If the statement introduces more hawkish language on inflation persistence, rate-sensitive assets including digital currencies may respond accordingly; if the tone is read as keeping later-2026 cuts alive, the reaction may run in the other direction. Historically, non-projections meetings with clear holds have produced moves driven entirely by tone rather than headline decision. Relevant markets on Kraken Pro: BTC/USD , ETH/USD , and all USD-denominated spot and margin pairs . Q1 2026 GDP advance estimate — April 30 The Bureau of Economic Analysis releases its first official read on Q1 2026 US economic growth on Thursday, April 30. This advance estimate is the earliest of three rounds and the one markets respond to most sharply. The context is loaded. Q4 2025 GDP was revised down to just 0.5% on the third estimate, from 1.4% at the advance stage, a significant deterioration that only became clear in retrospect. Q1 sits in a more disrupted environment: oil near $100 through much of the quarter, a reset tariff regime following the IEEPA ruling, and business confidence data that began reflecting Iran-conflict-related headwinds from late February onward. The GDP print arrives simultaneously with PCE and the Employment Cost Index, the morning after the FOMC decision. Traders will be interpreting all three data points through whatever framework Powell’s press conference established the previous afternoon. Historically, macro-sensitive assets including digital currencies have responded to GDP surprises in both directions; the size of any move has varied significantly with the prevailing rate environment. Relevant markets: BTC/USD , ETH/USD , and USD-denominated spot and margin pairs on Kraken Pro . PCE inflation, Personal Income and Outlays (March) — April 30 March Personal Income and Outlays (which contains the PCE price index, the Federal Reserve’s preferred inflation gauge) releases at 8:30 a.m. ET on April 30, simultaneously with the GDP print. Traders absorb growth and inflation data in a single moment. The most recent core PCE reading came in at 2.7%, above the Fed’s 2% target. Two factors make the March reading potentially more difficult: oil prices near $100 passed through to consumer energy costs during the survey period, and tariff-related goods price increases are beginning to reach end consumers. The Fed’s rate path for the rest of 2026 depends substantially on whether core PCE shows renewed upward momentum or holds near the prior reading. If Q1 GDP is weak and core PCE is elevated, the combination tightens the policy constraint; growth is slowing but inflation is not, limiting the Fed’s flexibility to respond to either problem. Historically, rate-sensitive assets have responded to this kind of data combination with elevated volatility. Relevant markets: BTC/USD , ETH/USD , spot and margin pairs on Kraken Pro . Employment Cost Index Q1 2026 — April 30 The Employment Cost Index, also released at 8:30 a.m. ET on April 30, measures the quarterly change in total compensation across all civilian workers. Q4 2025 came in at 0.7% quarterly and 3.4% annually. The ECI is distinct from other wage measures in that it controls for changes in the mix of workers and jobs, making it the Fed’s most reliable read on structural wage pressure. For that reason, the Fed has treated it as one of the most important single data points in assessing whether inflation is re-anchoring or remaining sticky above target. A Q1 print above 0.8% quarterly, arriving alongside a soft GDP and elevated PCE reading, would be the data configuration most likely to delay any Fed rate adjustment through the summer. Traders monitoring rate probabilities for the June meeting should treat the ECI as potentially the most consequential number in a very busy morning. Relevant markets: all rate-sensitive assets on Kraken Pro , including spot and margin pairs . Tesla Q1 2026 earnings — April 22, after close Tesla reports Q1 2026 results tonight. Q1 production came in at 408,386 vehicles and deliveries at 358,023. Street consensus sits at approximately $0.37 EPS on $22.71 billion revenue, though some analyst estimates sit meaningfully below that. The more consequential question on tonight’s call is capital allocation. Media reports have described Tesla in early-stage conversations with suppliers around a large-scale AI compute facility (referred to in reports as “Terafab”) that would represent a substantial expansion beyond Tesla’s existing $20 billion 2026 capex guide. Tesla has not confirmed the scope or timeline of this project in any official filing. If the call includes disclosure on the scale of AI infrastructure ambition, traders will be assessing the balance sheet and cash flow implications alongside an auto division already managing elevated inventory following the Q1 delivery miss. Crypto markets have historically shown correlation with broad technology sentiment during periods of equity volatility. Relevant markets: BTC/USD and ETH/USD as broad risk proxies on Kraken Pro . Deribit Monthly BTC/ETH Options Expiry — April 24 The Deribit monthly BTC and ETH options expiry falls on Friday, April 24, the last Friday of April and the date on which Deribit settles its monthly contracts. This is distinct from the weekly expiry cycle and typically represents a larger volume of open interest resolving simultaneously. Monthly expiries are associated with increased implied volatility in the days preceding settlement, as traders roll or close positions and market makers adjust hedges. This expiry lands ahead of the macro data and earnings cluster from April 29 onward and traders active in BTC and ETH derivatives should factor the positioning dynamics into their planning for what follows. Relevant markets: BTC/USD and ETH/USD spot, margin , and futures on Kraken Pro . Microsoft, Alphabet, Meta, and Amazon Earnings — April 29, after close Four of the world’s largest companies report Q1 2026 earnings on Wednesday evening, the same day as the FOMC decision. Microsoft (Q3 FY26), Alphabet, Meta, and Amazon deliver results after the close, meaning traders process the Fed’s afternoon communication before the earnings hit. The shared narrative across all four is AI capital expenditure and whether it is producing commensurate revenue growth. Microsoft guided Azure constant-currency growth at 37–38% for Q3 following 39% in Q2, against a quarterly capex rate that has risen sharply year-over-year. Alphabet’s 2026 capex guide has been described as approximately double 2025 levels, while Meta disclosed a $115–$135 billion full-year capex plan that was nearly double its 2025 spend. Each management team will face questions about whether AI monetization is accelerating fast enough to justify the investment trajectory. For crypto traders, the macro read-across is risk appetite. Historically, a cluster of confident tech earnings guidance has supported broader risk-on conditions; a cluster of misses or cautious capex commentary has coincided with risk-off moves across equities and digital assets. Past market behavior is not a reliable indicator of future results. Relevant markets: BTC/USD and ETH/USD spot and margin pairs on Kraken Pro . Apple Q2 FY26 Earnings — April 30, after close Apple reports fiscal Q2 2026 results on Thursday evening, the same day as the macro triple-header. The company guided Q2 revenue growth of 13–16%, implying approximately $107.8 billion to $110.7 billion. Q1 was described as a record quarter. The Apple call carries a specific signal beyond the headline numbers: services revenue growth and any commentary on tariff impacts to component supply chains. If Apple reaffirms or upgrades guidance in an environment where consumer confidence is below 100 and oil is elevated, it signals that premium consumer demand is holding despite macro headwinds. If guidance is reduced citing supply chain or demand pressure, the implications extend well beyond Apple. Relevant markets: BTC/USD and ETH/USD as risk sentiment proxies on Kraken Pro . Strategy (MSTR) Q1 2026 Earnings — May 5, after close Strategy reports Q1 2026 earnings on Tuesday, May 5. The company ended 2025 holding approximately 713,502 BTC and has transitioned to fair-value accounting for its digital asset holdings, meaning quarterly Bitcoin price movements flow directly through to reported earnings and book value. The primary signal from the Strategy call is continued accumulation intent and whether the company’s equity issuance program remains active. Any change to the BTC accumulation cadence (or commentary on the fair-value accounting implications) would be notable given the scale of Strategy’s holdings relative to circulating supply. Relevant markets: BTC/USD on Kraken Pro . Also coming up: Conference Board Consumer Confidence for April releases Tuesday, April 28, following a March reading in which inflation expectations rose sharply. Advance Durable Goods for March releases Wednesday, April 29. ISM Manufacturing PMI for April — the first full monthly read under current oil and conflict conditions — releases Friday, May 1. JOLTS March job openings and ISM Services PMI for April both release Tuesday, May 5. Closing context The sequencing here is what makes the next two weeks worth mapping in advance. The FOMC decision and press conference on April 29 will establish the interpretive frame for the GDP, PCE, and ECI data that print the following morning. Apple’s guidance that same Thursday evening closes a 36-hour window in which the growth, inflation, wage, and corporate earnings picture will all update simultaneously. Knowing in advance what scenarios you are watching for (and which Kraken Pro markets are most directly exposed) is what separates reactive trading from deliberate strategy. Explore markets on Kraken Pro This content is for informational purposes only and does not constitute financial advice. Past market behavior is not a reliable indicator of future results. Trading involves risk. The post FOMC decision, GDP, PCE, and Big Tech earnings, all in the next 2 weeks appeared first on Kraken Blog .
Kraken Blog 2026-04-22 11:30
🚨 Sui-based $VOLO protocol lost $3.5 million from three vaults. Attackers targeted vaults holding WBTC, XAUm, and USDC, freezing only $500,000 so far. Continue Reading: Sui-based voLO protocol hacked, $3.5 million lost from vaults The post Sui-based voLO protocol hacked, $3.5 million lost from vaults appeared first on COINTURK NEWS .
CoinTurk News 2026-04-22 11:30
The effects of the KelpDAO attackers go deeper, this time affecting even BTC trading. Some of the funds from the exploit were moved through ThorChain and swapped into BTC. The KelpDAO hack has wider effects on the crypto ecosystem, as the hackers attempt to swap and mix their holdings. The latest move showed the funds moved through ThorChain and were swapped into BTC. The hack brought another $211M in spot buying to BTC, and was one of the factors that sent BTC above $78,000. BTC rallied within hours, launching from its lower range of $75,000. For now, BTC rejected the $78,000 level, but the hackers indicated that the market would react to an inflow of buyers. KelpDAO boosted ThorChain volume ThorChain has been one of the platforms widely used to swap funds in a totally permissionless environment. In previous hacks reported by Cryptopolitan, ThorChain’s team has not cooperated to intercept the funds during bridging or other visible operations. The chain has not even set up a mechanism to intercept funds, as all transactions depend on 95 permissionless nodes. THORChain was modelled after Bitcoin, to be permissionless and censorship resistant. There’s no single person or entity in control of the protocol. There’s no admin key. There’s no 2-of-3 multisig. Currently, there’s 95 nodes spread globally that control the network. For the… pic.twitter.com/Za2Obrh9dO — THORChain (@THORChain) April 21, 2026 During previous incidents, ThorChain has allowed funds to be mixed and disguised, citing its main goal of not interfering. Yet after Web3 hacks accelerated in the past month, all participants reconsidered the need to freeze funds and diminish the losses. The KelpDAO attackers moved funds just three hours after Arbitrum froze around 25% of their haul on the network. One of the identified wallets was used to move and swap ETH, based on Arkham Intelligence tracking . The hacker’s activity boosted ThorChain activity to 10 times its normal daily volume, ending up with 442 BTC moved to 400 addresses. On-chain researchers have pinpointed some of the key addresses with the biggest holdings. The coins can be mixed further or swapped into privacy coins to disguise their origin. ThorChain posted its biggest daily fees after the KelpDAO attackers used the protocol to swap ETH for BTC. | Source: DeFiLlama . Following the attack, ThorChain recorded its highest daily fee volume for the year to date. The network helped the hackers perform on average 146 transactions an hour. KelpDAO attackers moved funds to the Bitcoin chain Additional on-chain research shows the funds from the KelpDAO hack were mixed with proceeds from other incidents, including the BTC Turk and Bybit attacks from 2025. ThorChain also refused to assist with the Bybit hack, though other ecosystem participants were ready to freeze funds where possible. The latest laundering episode shows the TraderTraitor group and other DPRK hackers were an increasing threat to Web3. The ability to launder funds is adding more risk, as hackers have evolved their techniques for faster and untraceable laundering. After using ThorChain, the hackers moved all BTC on the main network, where the coins could be traced, but not frozen. The KelpDAO exploit also affected other networks, creating significant outflows. Ethereum lost 17.73% of its total value locked, 17.68% flowed out of Hyperliquid, Arbitrum lost 13.65% of its liquidity, and Solana saw 6.14% in outflows. The lost funds may have wide repercussions on Web3, due to the composability of DeFi lending and reusing some coins for collateral on other protocols. The final estimate is that the hack led to around 177M in bad debt on Aave. Still letting the bank keep the best part? Watch our free video on being your own bank .
Cryptopolitan 2026-04-22 11:30
BitcoinWorld UK CPI Inflation Climbs to 3.3% YoY in March: Surprising Resilience in Consumer Prices UK CPI inflation climbed to 3.3% year-on-year (YoY) in March 2025, matching economists’ expectations. This marks a significant increase from the 3.0% reading recorded in February 2025. The data, released by the Office for National Statistics (ONS) on April 16, 2025, underscores persistent price pressures within the British economy. This development arrives amid ongoing debates about the Bank of England’s monetary policy path. Drivers Behind the UK CPI Inflation Climb to 3.3% Several key sectors contributed to the UK CPI inflation climb. Core inflation, which excludes volatile food and energy prices, also rose. It increased from 3.5% in February to 3.7% in March. Services inflation, a closely watched measure by the Bank of England, remained elevated at 5.1%. This stubbornly high services component suggests that domestic price pressures are still strong. Food and non-alcoholic beverage prices saw a monthly increase of 0.5%. Housing and household services, including electricity and gas, contributed significantly. Transport costs also added upward pressure, driven by higher fuel prices and airfares. These factors combined to push the headline rate higher. Comparing March 2025 UK Inflation with Forecasts The March figure exactly matched the consensus forecast from a Reuters poll of economists. This alignment provides some relief for markets. However, the details within the report reveal a more complex picture. The month-on-month (MoM) CPI change was 0.6%, up from 0.4% in February. This indicates that price increases accelerated during the month. Producer price inflation also showed upward movement. Input prices rose by 1.2% MoM, while output prices increased by 0.8%. These upstream pressures may feed into consumer prices in the coming months. The data reinforces the view that inflation is proving stickier than previously anticipated. Bank of England’s Response to Sticky Inflation The Bank of England (BoE) faces a difficult decision. The Monetary Policy Committee (MPC) has maintained the base rate at 4.5% since February 2025. The latest inflation data reduces the likelihood of an early rate cut. Market expectations for a May 2025 rate reduction have fallen sharply. Traders now see only a 20% chance of a cut, down from 40% before the release. BoE Governor Andrew Bailey has repeatedly emphasized a ‘data-dependent’ approach. He has warned that services inflation and wage growth remain too high. The March CPI report supports his cautious stance. The MPC will likely hold rates steady at its next meeting on May 8, 2025. Impact on UK Households and Spending Power The UK CPI inflation climb directly affects household budgets. Real wages, adjusted for inflation, have grown only modestly. The latest ONS data shows average weekly earnings grew by 5.6% YoY in February. However, with inflation at 3.3%, real wage growth stands at just 2.3%. This limits consumer spending capacity. Essential items continue to see the steepest price rises. Key categories with above-average inflation include: Housing & utilities: Up 4.2% YoY Food & non-alcoholic drinks: Up 3.8% YoY Restaurants & hotels: Up 4.5% YoY Education: Up 5.1% YoY These categories represent a larger share of spending for lower-income households. Therefore, the impact of inflation is unevenly distributed across society. The Resolution Foundation estimates that the poorest 20% of households face an effective inflation rate of 3.8%. Market Reaction to the March CPI Data Financial markets reacted swiftly to the UK CPI inflation release. The British pound strengthened against both the US dollar and the euro. Sterling rose 0.4% to $1.2950 and gained 0.3% against the euro to €1.1720. Bond yields also moved higher. The yield on the 10-year UK gilt increased by 8 basis points to 4.32%. The FTSE 100 index opened lower, declining by 0.5% in early trading. Higher inflation expectations typically weigh on equity valuations, particularly for growth stocks. However, banking stocks rose on the prospect of higher-for-longer interest rates. This divergence reflects the complex market dynamics at play. Global Context: Inflation Trends Across Economies The UK is not alone in experiencing sticky inflation. The US CPI for March came in at 3.5% YoY, above the Federal Reserve’s 2% target. The Eurozone harmonized index of consumer prices (HICP) stood at 2.4% in March. However, the UK’s inflation rate remains the highest among G7 nations. This persistent differential has implications for currency markets and trade competitiveness. Supply chain disruptions, rising energy costs, and tight labor markets are common themes across advanced economies. The UK’s specific challenges include Brexit-related trade frictions and a smaller labor force. These structural factors may keep UK inflation structurally higher than peers. Timeline of UK Inflation: From Peak to Current Levels UK CPI inflation peaked at 11.1% in October 2022. Since then, it has followed a downward but bumpy trajectory. Key milestones include: October 2022: Peak at 11.1% June 2023: Falls below 8% for first time in a year November 2023: Drops to 3.9% February 2024: Reaches 2-year low of 3.4% September 2024: Briefly touches 1.7% (below 2% target) December 2024: Rebounds to 2.5% March 2025: Rises to 3.3% This timeline illustrates that the battle against inflation is far from over. The BoE’s target of 2% remains elusive. The current trajectory suggests that inflation may stay above target for the remainder of 2025. Expert Analysis and Forward-Looking Perspectives Economists have weighed in on the implications of the March CPI data. Samuel Tombs, Chief UK Economist at Pantheon Macroeconomics, noted that ‘the details of the report are more worrying than the headline. Services inflation remains entrenched above 5%, which will alarm MPC hawks.’ Ruth Gregory, Deputy Chief UK Economist at Capital Economics, offered a slightly more optimistic view. She stated that ‘while the March data is disappointing, we expect inflation to fall back towards 2.5% by the end of 2025 as energy price base effects fade.’ However, she cautioned that ‘the risks are skewed to the upside.’ The Institute for Fiscal Studies (IFS) highlighted the fiscal implications. Higher inflation increases government debt servicing costs. The UK’s debt interest payments are linked to the Retail Prices Index (RPI), which stood at 3.8% in March. This adds pressure on Chancellor Rachel Reeves’ fiscal headroom ahead of the Autumn Budget. Conclusion The UK CPI inflation climb to 3.3% YoY in March 2025 confirms that price pressures remain stubbornly elevated. While the headline figure matched expectations, the persistence of services inflation and core inflation signals a challenging path ahead. The Bank of England will likely maintain its cautious stance, keeping interest rates higher for longer. Households will continue to face cost-of-living pressures, particularly in essential categories. Financial markets have adjusted their expectations accordingly, with the pound strengthening and rate cut bets fading. The data reinforces the importance of monitoring inflation trends closely as the UK economy navigates this complex period. FAQs Q1: What is the current UK CPI inflation rate for March 2025? The UK CPI inflation rate for March 2025 is 3.3% year-on-year, matching economists’ forecasts. Q2: How does March 2025 inflation compare to previous months? It represents an increase from 3.0% in February 2025 and 2.5% in December 2024, indicating a rising trend. Q3: What are the main drivers of the UK CPI inflation climb? Key drivers include housing and utilities, food prices, transport costs, and persistently high services inflation at 5.1%. Q4: Will the Bank of England cut interest rates after this data? The likelihood of a May 2025 rate cut has decreased significantly. The MPC is expected to hold rates at 4.5% at its next meeting. Q5: How does UK inflation compare to other major economies? The UK’s 3.3% rate is the highest among G7 nations, compared to 3.5% in the US and 2.4% in the Eurozone. This post UK CPI Inflation Climbs to 3.3% YoY in March: Surprising Resilience in Consumer Prices first appeared on BitcoinWorld .
Bitcoin World 2026-04-22 11:30
Tron founder Justin Sun filed a lawsuit in a California federal court against World Liberty Financial, the Trump-backed decentralized finance ( DeFi) project, alleging his $75 million WLFI token position was frozen without disclosure. Key Takeaways: Justin Sun filed a California federal lawsuit against WLFI on April 22 over $75 million in frozen tokens. Sun
Bitcoin.com 2026-04-22 11:30
Investing.Com Crypto Opinion and Analysis 2026-04-22 11:27
This is it! The bulls have pushed the $BTC price to the top of the bear flag. Either it’s a breakout here, or a rejection back into the midst of the flag. Are we about to ascend into the next bull market, or do the bears have what it takes to drag the price back down again and continue the bear market? Higher high and breakout, or is $BTC topping out? Source: TradingView From the bullish perspective, the $BTC price has made a higher high, falling just short of the top of the bear flag . However, from the bears’ point of view, the price may be topping out here. A light resistance level has been found at around $78,000 and the price has stopped there, at least for the time being. At the bottom of the chart, the Stochastic RSI indicators are nearing the top of their limit. It just remains to be seen whether there is enough in the tank for that one last surge that takes the price on through. If the price does get above, and confirms, the momentum from this breakout could take the price a lot higher. Breakout measured move to $90,000 Source: TradingView The daily chart reveals the sustained break beyond the downtrend line, and also how the $BTC price could be about to leave the bear flag behind - a very bullish thing in itself. The measured move out of the flag, which is taken from the bottom to the top of the channel, would be to around $90,000. As can be seen in the chart, this would take the price to an exact level of resistance. Further down in the chart, the Stochastic RSI indicators in this daily time frame have turned back around, and there is plenty of room for them to continue to signal upside momentum. At the foot of the chart, the RSI indicator can be seen to have come back again to the underside of the downtrend line after a previous rejection . Could it be second time lucky for the bulls? A perfect bullish breakout, or … Source: TradingView The weekly chart tells us a story that looks as though it can go firmly in favour of the bulls. If one looks inside the current bear flag, a W pattern can clearly be seen in the price action. This is somewhat similar, but bigger, than the W pattern that took the $BTC price out of the previous big pattern of the falling wedge. Look what happened when that one broke out of the wedge. The Stochastic RSI indicators are moving towards the top. All would appear perfect for this breakout. Do the bears have a card up their sleeves that could still ruin everything for the bulls? Disclaimer: This article is provided for informational purposes only. It is not offered or intended to be used as legal, tax, investment, financial, or other advice.
Crypto Daily 2026-04-22 11:26
 Attackers behind KelpDAO breach help lift Bitcoin