The transfer effectively moves part of Li’s private trading operation into a public company where he is the largest shareholder.
CoinDesk 2026-04-22 08:13
BitcoinWorld Aptos Price Prediction 2026-2030: Can APT Realistically Surge to $30 by 2026? As the cryptocurrency market continues its evolution in 2025, investors and analysts are scrutinizing layer-1 blockchain platforms with renewed vigor. Among them, Aptos (APT) has generated significant discussion regarding its long-term valuation trajectory. This analysis provides a comprehensive Aptos price prediction, examining the technical, fundamental, and macroeconomic factors that could influence its path toward a potential $30 valuation by 2026 and beyond through 2030. Aptos Price Prediction: Foundation and Current Market Context The Aptos blockchain launched in 2022 with substantial backing and a team originating from Meta’s discontinued Diem project. Consequently, its technical foundation, the Move programming language and parallel execution engine, receives frequent scrutiny from developers. Market data from early 2025 shows APT consolidating within a defined range, reflecting broader crypto market sentiment. Furthermore, network activity metrics, including daily transactions and active addresses, provide crucial context for any long-term Aptos price prediction. Analysts consistently compare these fundamentals against other layer-1 solutions to assess competitive positioning. Several key factors will directly influence the APT price forecast. First, adoption by decentralized applications (dApps) and major enterprises serves as a primary growth driver. Second, the broader regulatory environment for smart contract platforms remains a critical variable. Finally, the execution of the project’s technical roadmap, including upgrades to throughput and finality, impacts investor confidence. Historical volatility patterns for similar assets also offer valuable comparative data for modeling future price ranges. Technical Analysis and the $30 Target for 2026 Reaching a $30 price point by 2026 represents a significant appreciation from early 2025 levels. This target implies a specific market capitalization, which analysts weigh against projected total value locked (TVL) and revenue potential. Technical chart analysis identifies major resistance and support levels that APT must navigate. For instance, breaking past previous all-time high regions would require sustained buying pressure and positive catalyst events. Market cycles historically influence all cryptocurrency valuations. The projected timeline towards 2026 coincides with potential phases of the broader macroeconomic cycle, including interest rate environments and institutional adoption trends. A comparative table illustrates the required growth: Target Price Approx. Market Cap* Required Growth from Early 2025* $30 ~$13 Billion ~400% $20 ~$8.7 Billion ~233% $10 ~$4.3 Billion ~67% *Estimates based on approximate circulating supply; actual figures may vary. Expert Perspectives on Adoption and Valuation Blockchain analysts emphasize that price follows utility. Reports from firms like Messari and CoinMetrics often highlight network health indicators. For example, a consistent increase in unique active wallets and a diversified dApp ecosystem would support a bullish Aptos price prediction. Conversely, stagnation in developer activity or security incidents could present headwinds. Experts from venture firms that backed Aptos’ initial rounds sometimes provide commentary on development milestones, though they typically avoid specific price targets. Institutional adoption forms another critical piece of the puzzle. Integration with major custody solutions, listing on regulated exchanges, and the launch of financial products like ETFs or futures could dramatically increase APT’s liquidity and investor base. The timeline for these events remains uncertain, but their potential impact is factored into long-term models. Aptos Forecast for 2027, 2028, 2029, and 2030 Looking beyond 2026, predictions become inherently more speculative due to the rapid pace of technological change. However, analysts create scenarios based on continued execution. The 2027-2030 period for Aptos will likely be defined by several overarching trends: Market Saturation: Competition with other layer-1 and layer-2 networks. Technology Maturation: Real-world proof of the network’s scalability and security claims at mass scale. Regulatory Clarity: Established global frameworks for blockchain governance and asset classification. Macro Integration: The role of blockchain in traditional finance (TradFi) and global supply chains. Potential price ranges for these years are modeled using discounted cash flow analyses on network fees, comparisons to traditional tech stock growth phases, and total addressable market (TAM) estimates for blockchain infrastructure. Most models show a range of possibilities, from conservative growth tied to general crypto market expansion to exponential growth scenarios driven by killer-app adoption on the Aptos network. Risk Factors and Downside Scenarios A balanced Aptos price prediction must account for significant risks. Technological obsolescence is a constant threat in the blockchain sector. A new platform could emerge with superior technology, drawing away developers and capital. Additionally, critical smart contract vulnerabilities or network outages could erode trust rapidly. Macroeconomic downturns that reduce risk appetite across all asset classes historically correlate with sharp declines in cryptocurrency valuations. Investors should consider these factors alongside bullish projections. Conclusion This Aptos price prediction analysis underscores the multitude of variables influencing APT’s journey toward $30 by 2026 and its longer-term trajectory. The target is ambitious, requiring a confluence of successful technical execution, robust ecosystem growth, and favorable market conditions. While the underlying technology shows promise, investors should prioritize fundamental research over speculative price targets. Monitoring network metrics, developer activity, and broader adoption trends will provide more reliable signals than price charts alone. The coming years will be a critical test for the Aptos blockchain and its place in the evolving digital asset landscape. FAQs Q1: What is the main driver behind the Aptos price prediction for $30 by 2026? The prediction primarily hinges on mass adoption of its blockchain, significant growth in its dApp ecosystem and total value locked (TVL), and a favorable broader cryptocurrency market cycle. Achieving this price also assumes successful execution of its technical roadmap. Q2: How does Aptos’ technology compare to competitors like Solana or Sui? Aptos uses the Move programming language and a parallel execution engine called Block-STM for high throughput. While it shares some DNA with Sui (both using Move), its architecture differs. Comparisons focus on transaction speed, finality time, developer experience, and real-world reliability under load. Q3: What are the biggest risks to this APT price forecast? Key risks include technological failure or obsolescence, intense competition from other layer-1 networks, a prolonged crypto bear market, adverse regulatory developments, and a failure to attract and retain major developers and projects on its platform. Q4: Do most analysts agree with the $30 Aptos price prediction for 2026? Analyst opinions vary widely. Some models are bullish based on potential, while others are more conservative, citing current adoption rates and market capitalization realities. Most reputable analysts present a range of scenarios rather than a single fixed price target. Q5: How should an investor use this Aptos price prediction information? Investors should treat any long-term prediction as a speculative scenario analysis, not financial advice. It is crucial to conduct independent research, understand the technology, assess network activity metrics, and only invest capital one is prepared to lose, given the asset’s volatility. This post Aptos Price Prediction 2026-2030: Can APT Realistically Surge to $30 by 2026? first appeared on BitcoinWorld .
Bitcoin World 2026-04-22 08:10
Dogecoin started a recovery wave above the $0.0940 zone against the US Dollar. DOGE is now facing hurdles near $0.0975 and might struggle to continue higher. DOGE price started a recovery wave from $0.0925 and climbed above $0.0940. The price is trading above the $0.0950 level and the 100-hourly simple moving average. There is a rising channel forming with resistance at $0.0970 on the hourly chart of the DOGE/USD pair (data source from Kraken). The price could continue to move up if it stays above $0.0925. Dogecoin Price Hits Resistance Dogecoin price started a recovery wave from the $0.0925 zone, like Bitcoin and Ethereum . DOGE climbed above the $0.0935 and $0.0942 resistance levels. There was a decent upward move above the 23.6% Fib retracement level of the downward move from the $0.1021 swing high to the $0.0926 low. However, the bears remained active near the $0.0970 zone. Besides, there is a rising channel forming with resistance at $0.0970 on the hourly chart of the DOGE/USD pair. Dogecoin price is now trading above the $0.0950 level and the 100-hourly simple moving average. If there is another recovery wave, immediate resistance on the upside is near the $0.0970 level. The first major resistance for the bulls could be near the $0.0975 level or the 50% Fib retracement level of the downward move from the $0.1021 swing high to the $0.0926 low. The next major resistance is near the $0.10 level. A close above the $0.10 resistance might send the price toward the $0.1020 resistance. Any more gains might send the price toward the $0.1065 level. The next major stop for the bulls might be $0.1120. Another Decline In DOGE? If DOGE’s price fails to climb above the $0.0975 level, it could continue to move down. Initial support on the downside is near the $0.0950 level. The next major support is near the $0.0932 level. The main support sits at $0.0925. If there is a downside break below the $0.0925 support, the price could decline further. In the stated case, the price might slide toward the $0.090 level or even $0.0880 in the near term. Technical Indicators Hourly MACD – The MACD for DOGE/USD is now losing momentum in the bullish zone. Hourly RSI (Relative Strength Index) – The RSI for DOGE/USD is now above the 50 level. Major Support Levels – $0.0950 and $0.0925. Major Resistance Levels – $0.0975 and $0.10.
NewsBTC 2026-04-22 08:08
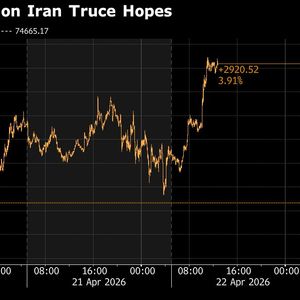
Bitcoin climbed above $77,000 after the US extended its ceasefire deadline with Iran, calming immediate geopolitical fears and supporting a mild recovery in crypto markets. Oil prices slipped as tensions eased, with Brent crude and WTI crude both falling over 2%, signaling reduced concerns over supply disruptions. Institutional demand remains a steady driver, as strong inflows into Bitcoin ETFs continue to tighten supply and shape price trends despite mixed short-term market sentiment. Bitcoin moved back above the $77,000 mark after a shift in geopolitical developments involving the US and Iran. The price recovery followed news that the ceasefire deadline between the two sides would be extended. This eased immediate market concerns and brought a decent sense of stability across risk assets. Bitcoin was trading at $77,518.04 at the time of writing. The crypto rose 2.45% in 24 hours. The gesture was small but significant: It emerged after a period of uncertainty associated with international tensions. Ethereum also recorded a slight increase. It was at $2,361, a 2.28 percent increase for the same time period. Bitcoin Surged above $77K Mark As did Donald Trump’s speech the day before. The US would postpone a planned military strike on Iran, he said. The decision came after requests from Pakistan’s leadership, including its Prime Minister and Army Chief. The US has now extended the ceasefire deadline and asked Iran to present a unified proposal for negotiations. The statement also clarified that military readiness would remain in place. A naval blockade on Iran would continue during this period. The ceasefire, according to the announcement, will stay active until Iran submits a proposal and the negotiation process is completed. The outcome of those talks remains uncertain. Iran responded through its state media. Officials claimed the country had already secured a strong position in the conflict. Control over the Strait of Hormuz was highlighted as a key advantage. This route remains one of the most important channels for global oil shipments. Iran confirmed a temporary halt in military operations. At the same time, it maintained that the conflict had not ended. Officials also called for caution toward negotiations. They said any talks should honour Iran’s independence and its national priorities. These comprise defense systems, missile programs, and nuclear technology. The change in tone had an immediate impact on energy markets. The announcement sent oil prices lower. Brent crude plunged more than 2% from its intraday high and settled near $93.45 per barrel. WTI crude also declined by over 2%, trading at about $91.75 a barrel. The easing in oil prices suggested diminishing worries about immediate supply disruption. Crypto markets responded in parallel. Bitcoin’s comeback was a positive response to the rising sentiment across. While the price increase remained limited, the move showed how closely digital assets track macro signals during periods of tension. Institutional demand continues to support Bitcoin’s structure. U.S. spot Bitcoin exchange-traded funds have emerged as a major driver. As of April 22, 2026, total assets under management in these ETFs stood at $102.91 billion. Recent data shows a strong link between ETF inflows and price movements. After a phase of outflows, March saw a reversal. Net inflows reached $1.32 billion during the month. Each inflow requires actual Bitcoin purchases. This reduces the available supply on exchanges and adds upward pressure on price over time. At the same time, it concentrates holdings within institutional channels. Technically, Bitcoin faces immediate resistance at the recent swing high of $78,320. A decisive break above this level could open a path toward the 127.2% Fibonacci extension at $81,951. Key support lies at the 23.6% retracement level of $75,170.
CryptoNewsZ 2026-04-22 08:05
BitcoinWorld Gold Price Surges as US Dollar Retreats on US-Iran Ceasefire Extension; Market Lacks Bullish Conviction Gold prices experienced a notable upward movement in global markets on Tuesday, December 9, 2025, as the US dollar retreated following confirmation of a ceasefire extension between the United States and Iran. The precious metal gained approximately 1.8% during the London trading session, reaching $2,485 per ounce, though analysts noted the rally lacked strong bullish conviction amid mixed market signals. Gold Price Movement Amid Geopolitical Developments The immediate catalyst for gold’s price increase came from currency markets. Specifically, the US dollar index (DXY) declined by 0.6% against a basket of major currencies. This movement followed diplomatic announcements from both Washington and Tehran. Consequently, market participants reduced their safe-haven dollar holdings. Meanwhile, gold traditionally benefits from dollar weakness since it becomes cheaper for holders of other currencies. Market data from the London Bullion Market Association shows specific trading patterns. For instance, spot gold traded between $2,460 and $2,492 throughout the session. Additionally, trading volume remained 15% below the 30-day average. This suggests cautious participation despite the price increase. Furthermore, the gold-to-silver ratio widened slightly to 88:1, indicating relative gold strength. US-Iran Ceasefire Extension Details and Market Impact The geopolitical context provides crucial background for understanding market movements. The United States and Iran agreed to extend their existing ceasefire arrangement for an additional 90 days. This agreement represents the third extension since initial negotiations concluded in late 2024. Importantly, the extension includes continued monitoring of nuclear facilities and maintains existing sanctions frameworks. Financial markets responded with measured optimism. For example, Brent crude oil prices declined by 2.1% to $78.30 per barrel. Similarly, Treasury yields edged lower across the curve. However, analysts from major institutions expressed caution. “While the ceasefire extension reduces immediate geopolitical risk premiums,” noted Sophia Chen, Senior Commodities Strategist at Global Markets Research, “structural tensions remain unresolved. The market recognizes this as a temporary de-escalation rather than a permanent solution.” Historical Context of Gold During Geopolitical Events Historical analysis reveals consistent patterns in gold’s behavior during geopolitical developments. The table below illustrates gold’s performance during similar ceasefire announcements over the past decade: Event Date Gold Price Change DXY Change US-Iran Initial Ceasefire Nov 2024 +2.3% -0.8% Russia-Ukraine Grain Deal Jul 2023 +1.7% -0.5% North Korea Missile Test Halt Jun 2022 +1.1% -0.3% This historical data demonstrates that gold typically experiences short-term rallies during geopolitical de-escalations. However, these gains often prove temporary without sustained fundamental drivers. Currently, the market faces several countervailing forces: Supportive Factors: Dollar weakness, lower bond yields, reduced immediate conflict risk Limiting Factors: Moderate inflation expectations, strong equity markets, limited physical demand Market Sentiment and Lack of Bullish Conviction Despite the price increase, several indicators reveal underlying market skepticism. Open interest in COMEX gold futures increased by only 2.1%, significantly below the 5% threshold that typically signals strong conviction. Meanwhile, ETF holdings for major gold funds showed minimal changes. The SPDR Gold Shares (GLD) reported inflows of just 0.8 tonnes, representing a negligible percentage of total assets. Technical analysis provides additional perspective. Gold failed to decisively break above the critical $2,500 resistance level that has capped rallies since October. Moreover, the 50-day moving average at $2,455 provided support but didn’t demonstrate strong upward momentum. “The price action suggests short-covering rather than new bullish positioning,” observed Michael Rodriguez, Chief Technical Analyst at Precious Metals Insights. “We’re seeing reactionary trading, not structural reallocation into gold.” Central Bank Policies and Interest Rate Outlook Monetary policy considerations continue to influence gold markets significantly. The Federal Reserve maintains its benchmark rate at 4.25-4.50%, with market expectations pointing toward potential cuts in mid-2026. Real interest rates, calculated as nominal rates minus inflation expectations, remain positive at approximately 1.2%. Historically, positive real rates create headwinds for non-yielding assets like gold. Global central bank activity provides some counterbalance. According to World Gold Council data, central banks purchased 228 tonnes of gold in Q3 2025, continuing a multi-year trend of diversification away from dollar reserves. However, this institutional buying occurs gradually and doesn’t typically drive short-term price spikes. Instead, it provides underlying support during periods of dollar weakness. Comparative Analysis with Other Safe Haven Assets The reaction across traditional safe haven assets reveals nuanced market interpretation. While gold gained, other havens showed mixed performance: US Treasuries: 10-year yields fell 4 basis points to 3.82% Japanese Yen: Strengthened 0.4% against the dollar Swiss Franc: Gained 0.3% in European trading Bitcoin: Declined 1.2% to $64,300 This divergence suggests markets aren’t pricing in broad risk-off sentiment. Instead, the movement appears specific to dollar-denominated assets affected by the ceasefire news. The relatively modest moves across most havens support the interpretation of limited conviction behind gold’s rally. Physical Market Fundamentals and Demand Indicators Physical gold markets provide important context for price sustainability. Indian gold imports, a key demand indicator, totaled 78 tonnes in November 2025, representing a 12% year-over-year decline. Similarly, Chinese gold demand through the Shanghai Gold Exchange averaged 32 tonnes weekly in November, slightly below the 2024 average. These physical demand metrics don’t support sustained price appreciation without additional catalysts. Mining production data offers supply-side perspective. Global gold mine output reached 890 tonnes in Q3 2025, essentially unchanged from the previous quarter. Production costs averaged $1,250 per ounce, leaving healthy margins at current prices but not suggesting imminent supply constraints. Recycling activity increased by 8% year-over-year as higher prices encouraged scrap gold sales, adding to available supply. Conclusion Gold prices rose as the US dollar retreated following the US-Iran ceasefire extension, demonstrating the precious metal’s sensitivity to geopolitical developments and currency movements. However, the rally lacked strong bullish conviction, as evidenced by moderate trading volumes, limited ETF flows, and failure to break key technical resistance. Market participants appear to view the ceasefire extension as a temporary de-escalation rather than a structural shift in Middle East tensions. Consequently, gold’s near-term trajectory will likely depend more on monetary policy expectations and dollar direction than sustained geopolitical risk premiums. The gold price movement serves as a reminder of the complex interplay between geopolitics, currencies, and precious metals in global financial markets. FAQs Q1: Why does gold typically rise when the US dollar falls? Gold is priced in US dollars globally. When the dollar weakens, it takes fewer units of other currencies to purchase the same amount of gold, making it relatively cheaper for international buyers and increasing demand. Q2: What does “lacking bullish conviction” mean in market terms? This phrase indicates that while prices moved higher, supporting factors like trading volume, open interest, and fund flows didn’t show corresponding strength, suggesting the move may be temporary or driven by short-term factors rather than sustained investor belief in further appreciation. Q3: How do ceasefire agreements typically affect commodity markets? Ceasefire agreements generally reduce immediate geopolitical risk premiums, often leading to lower oil prices and decreased demand for safe-haven assets. However, the specific impact varies based on the conflict’s significance to global supply chains and the agreement’s perceived durability. Q4: What are the main factors that could provide stronger support for gold prices? Sustained dollar weakness, increased geopolitical tensions, higher inflation expectations, significant central bank buying, or a shift toward more dovish monetary policies from major central banks could provide stronger fundamental support for gold. Q5: How does the current gold price compare to historical averages? At approximately $2,485 per ounce, gold trades about 35% above its 10-year average of $1,840 but remains below its 2020 inflation-adjusted peak of around $2,800. The current price reflects both persistent geopolitical uncertainties and the transition to a higher interest rate environment compared to the previous decade. This post Gold Price Surges as US Dollar Retreats on US-Iran Ceasefire Extension; Market Lacks Bullish Conviction first appeared on BitcoinWorld .
Bitcoin World 2026-04-22 08:05
Bitcoin jumped along with equities on Wednesday after President Donald Trump said he would extend a ceasefire with Iran, bolstering market confidence.
Bloomberg (Crypto) 2026-04-22 08:03
Will Won-based stablecoins survive the Bank of Korea's chief plans to accelerate CBDC and commercial banks-issued deposit tokens?
AMB Crypto 2026-04-22 08:00
In a crypto landscape increasingly defined by fragmentation, the idea of unified liquidity is gaining traction, and Solana is positioning itself at the center of that conversation. Solana Foundation president explained that the network’s architecture was intentionally designed to keep liquidity on a single, high-performance layer rather than splitting it across multiple chains, bridges, and isolated environments. How Unified Liquidity Improves Market Efficiency The Solana Foundation president Calilyliu claimed that SOL is built for unified liquidity. According to a post on X, Calilyliu stated that no matter how advanced a technology may be, no participants is ever bigger than the market itself, and the most important thing in finance is liquidity. Related Reading: Solana Foundation Launches Developer Platform — TradFi And DeFi Giants Join The Push In an interview at the Solana Policy Institute’s Washington x Wall Street Summit, she highlighted that the market will always win, liquidity will always win, and people will ultimately trade off everything to participate in the largest market. Meanwhile, the scale of that opportunity to create a marketplace is unprecedented, with an estimated 5.5 billion people connected to the internet. There is no isolated pool of liquidity that will be larger than SOL. SOL’s architecture aims to support a single, global marketplace accessible to anyone online, which reinforces the network as the preferred infrastructure. By prioritizing unified liquidity from the start, SOL positions itself as the number one network designed for the full scale of the financial market. A New Foundation For Autonomous AI Agents To Operate On Solana In a recent post on X, SAEP introduced the agent economy protocol on Solana, a foundational infrastructure layer designed to enable autonomous artificial intelligence (AI) agents to operate as independent economic actors on SOL. Related Reading: Solana Value Proposition Extends Beyond Tech Into Economic Infrastructure Today, AI agents are already capable of executing tasks and generating real economic value, but they rely on centralized APIs and human-controlled wallets. There is no trustless framework that allows an agent to natively hold funds, take a job, verify completion, or resolve disputes without human intervention. SAEP is built to remove that limitation. At its core is a system of 10 interconnected Anchor programs that collectively define a machine-native economy. Agents are given on-chain identities, paired with staked reputation, and enforced through slash timelocks. At the financial layer, agents are equipped with sovereign PDA treasuries with programmable sending rules. SAEP also introduces a permissionless task marketplace, where agents can discover and execute jobs with atomic jito-bundled escrow. Payment is conditional and trustless, released only when Groth16 zero-knowledge proofs verification confirms that the required work has been completed. In case of conflict, SAEP integrates Switchboard VRF-powered dispute resolution, where bonded jurors and on-chain are randomly selected to arbitrate outcomes. Beyond execution, SAEP embeds governance, staking, and fee distribution directly into its architecture, creating a fully integrated economic system from day one. Lastly, security is enforced through audit-gated development, a 4-of-7 multisig, and a 7-day upgrade timelock. Featured image from iStock, chart from Tradingview.com
NewsBTC 2026-04-22 08:00
Nine out of 12 council members voted yes. That detail alone tells you how divided — and how serious — the conversation inside Arbitrum’s security council got before the blockchain took its most dramatic action in recent memory. A Council Under Pressure Griff Green, a sitting member of the Arbitrum Security Council, said the group wrestled with the decision for hours. The debates covered technical, practical, ethical, and political ground before the vote was cast. “We did not make this decision lightly,” Green posted on X. In the end, the council moved 30,766 Ether — worth roughly $71.2 million — out of a wallet linked to the Kelp protocol exploit and into what Arbitrum described as “an intermediary frozen wallet.” I’m a member of the Security Council & I can tell you we did not make this decision lightly, there were countless hours of debates, technical, practical, ethical and political. But all it takes for evil to triumph is for good men to do nothing, so today, we decided to do… https://t.co/tArbmXwZKN — Griff Green – griff.eth (@griffgreen) April 21, 2026 The funds cannot be touched by the address that originally held them. Only a further action by Arbitrum governance can move them now. Law enforcement was part of the conversation. Arbitrum confirmed the council worked with authorities before acting, a detail that sets this incident apart from the usual back-and-forth that follows a DeFi hack. The Arbitrum Security Council has taken emergency action to freeze the 30,766 ETH being held in the address on Arbitrum One that is connected to the KelpDAO exploit. The Security Council acted with input from law enforcement as to the exploiter’s identity, and, at all times,… — Arbitrum (@arbitrum) April 21, 2026 The Hack That Started It All The chain of events began Saturday, when Kelp — a liquid restaking protocol — was hit through its LayerZero-powered bridge. Reports indicate the theft totaled at least $293 million. LayerZero, the cross-chain messaging protocol involved, publicly pointed the finger at North Korea as the group behind the attack. The damage did not stop at Kelp. Whoever carried out the exploit used stolen Kelp tokens to borrow other cryptocurrencies on Aave, the lending platform. That move left Aave holding what risk managers described as bad debt — losses that spread through the broader crypto lending market because of how tightly connected these protocols are to one another. so a council can just freeze 30k eth and we’re still calling this decentralized? — Sandy.ETH (@david_lee2085) April 21, 2026 Backlash From The Community Not everyone welcomed Arbitrum’s response. On X, several users pushed back hard , arguing that a blockchain capable of freezing funds on council orders cannot honestly call itself decentralized. The criticism cuts at a long-standing tension in the crypto world: security measures that protect users can also be the same tools that override them. Arbitrum said the council weighed its responsibilities carefully, taking care not to affect other users or running applications on the network. Whether that assurance satisfies critics remains an open question. What is clear is that 30,000-plus ETH is now sitting in limbo, and the next move belongs to Arbitrum governance. Featured image from Unsplash, chart from TradingView
Bitcoinist 2026-04-22 08:00
BitcoinWorld Asian Stocks Show Mixed Signals as Hang Seng Plummets Amid Critical US-Iran Talks and Oil Market Turmoil Asian financial markets displayed divergent trajectories on Wednesday, with Hong Kong’s Hang Seng Index experiencing significant pressure as diplomatic developments between the United States and Iran injected uncertainty into regional trading sessions. Meanwhile, oil markets remained volatile, creating complex crosscurrents for energy-dependent economies across the Asia-Pacific region. Asian Stock Markets React to Geopolitical Developments Market participants across Asia monitored multiple factors simultaneously. The Hang Seng Index declined by 1.8% during the morning session, reflecting investor caution. Conversely, Japan’s Nikkei 225 gained 0.6% following positive corporate earnings reports. South Korea’s KOSPI remained relatively flat, moving just 0.1% higher. These mixed performances highlight the region’s diverse economic exposures and varying sensitivity to geopolitical events. Financial analysts identified several interconnected factors driving market movements. First, diplomatic talks between US and Iranian officials generated uncertainty about future energy supplies. Second, oil price fluctuations created divergent impacts across different Asian economies. Third, currency movements influenced foreign investor behavior. Finally, domestic economic data provided counterbalancing forces in some markets. US-Iran Diplomatic Engagement Reshapes Market Calculations The United States and Iran initiated their first direct high-level talks in over a year. These discussions focused primarily on regional security arrangements and nuclear program limitations. Market observers immediately assessed potential implications for global energy markets. Historically, improved US-Iran relations have correlated with increased Iranian oil exports. However, current negotiations face significant political hurdles in both nations. Energy analysts provided context about the oil market’s reaction. Brent crude futures initially declined 2.1% on news of the diplomatic opening. Subsequently, prices recovered half of those losses as traders considered implementation challenges. The volatility reflected market uncertainty about both the talks’ substance and their potential outcomes. Asian importers closely monitored these developments given their substantial energy needs. Expert Analysis of Energy Market Implications Dr. Li Wei, senior energy economist at the Asian Development Bank Institute, explained the regional implications. “Asian economies collectively represent over 40% of global oil consumption,” she noted. “Any significant change in Iranian export volumes would directly affect regional energy costs and trade balances.” She emphasized that markets were reacting to both immediate price movements and longer-term supply expectations. The table below illustrates Asian economies’ varying exposure to oil price changes: Economy Oil Import Dependency Key Sector Impacts Japan High (99% imported) Transportation, manufacturing South Korea Very High (100% imported) Petrochemicals, shipping India High (85% imported) Agriculture, consumer goods China High (73% imported) Industrial production, logistics Hong Kong’s Market Faces Multiple Pressure Points The Hang Seng Index’s underperformance reflected several Hong Kong-specific factors. Financial sector stocks declined 2.3% collectively. Property developers faced additional pressure from domestic regulatory concerns. Technology shares showed mixed performance despite broader sector stability elsewhere in Asia. Market volume exceeded the 30-day average by 15%, indicating heightened investor engagement. Several key elements contributed to Hong Kong’s market weakness: Geopolitical sensitivity: Hong Kong’s status as an international financial center makes it particularly responsive to global tensions Currency considerations: The Hong Kong dollar’s peg to the US dollar creates unique monetary policy constraints Sector composition: Heavy weighting in financial and property sectors amplifies certain market movements Regional integration: Close economic ties with mainland China create spillover effects from broader Asian trends Historical Context and Market Patterns Current market movements follow established historical patterns. During previous periods of US-Iran engagement in 2015 and 2021, Asian markets showed similar initial volatility. However, sustained trends depended on subsequent policy implementations. Energy-importing economies typically benefit from lower oil prices through reduced import costs. Conversely, energy-exporting nations within Asia face revenue pressures under such conditions. Market data reveals consistent relationships between diplomatic developments and regional performance. Analysis of the 2015 Joint Comprehensive Plan of Action period shows Asian markets gained an average of 3.2% in the month following agreement announcements. However, these gains concentrated in manufacturing-heavy economies rather than financial centers. This historical perspective helps explain current divergent performances across Asian exchanges. Broader Asian Market Responses and Economic Fundamentals Beyond Hong Kong, other Asian markets demonstrated more resilience. Japan’s positive performance reflected strong corporate earnings from automotive and technology exporters. South Korean markets benefited from semiconductor sector strength despite broader geopolitical concerns. Southeast Asian exchanges showed modest gains, with Singapore’s Straits Times Index advancing 0.4%. Economic fundamentals provided important context for these varied responses. Japan’s latest inflation data showed stabilization near the Bank of Japan’s target range. South Korea’s export figures exceeded expectations for the third consecutive month. China’s manufacturing PMI indicated expansion for the first time in six months. These underlying economic conditions helped buffer some markets against geopolitical uncertainty. Regional central banks maintained careful monitoring stances. The Bank of Japan continued its yield curve control program without modification. The Reserve Bank of India maintained interest rate stability in its latest policy meeting. The People’s Bank of China implemented targeted liquidity measures rather than broad policy changes. This coordinated caution reflected shared concerns about external volatility sources. Conclusion Asian stock markets presented a fragmented picture as geopolitical developments intersected with diverse economic fundamentals. The Hang Seng Index’s decline highlighted particular vulnerabilities in financial centers to diplomatic uncertainty. Meanwhile, other Asian markets demonstrated resilience through strong corporate performance and improving economic indicators. Oil price volatility remained a critical variable for regional economies, with potential implications for inflation, trade balances, and growth trajectories. Market participants will continue monitoring US-Iran diplomatic progress alongside domestic economic data for clearer directional signals. FAQs Q1: Why did the Hang Seng Index fall while other Asian markets showed mixed performance? The Hang Seng declined due to its particular sensitivity to geopolitical developments and its heavy weighting in financial and property sectors. Other Asian markets benefited from stronger corporate earnings and more favorable domestic economic conditions. Q2: How do US-Iran talks specifically affect Asian stock markets? These talks affect markets through multiple channels: oil price volatility impacts energy-importing economies, diplomatic uncertainty influences investor risk appetite, and potential changes to Middle Eastern stability affect regional trade routes and security considerations. Q3: What historical patterns exist between Middle Eastern diplomacy and Asian markets? Historical analysis shows Asian markets typically experience initial volatility during diplomatic openings, followed by more sustained trends based on implementation outcomes. Manufacturing-heavy economies often benefit from reduced energy costs, while financial centers face more complex reactions. Q4: Which Asian economies are most vulnerable to oil price changes? South Korea and Japan show the highest vulnerability due to nearly complete import dependence. India and China also face significant exposure, though both have implemented strategic petroleum reserves and diversified energy policies to mitigate risks. Q5: How are Asian central banks responding to current market conditions? Regional central banks maintain cautious stances, focusing on domestic inflation targets while monitoring external volatility. Most have avoided major policy shifts, instead implementing targeted measures to address specific economic challenges without overreacting to geopolitical developments. This post Asian Stocks Show Mixed Signals as Hang Seng Plummets Amid Critical US-Iran Talks and Oil Market Turmoil first appeared on BitcoinWorld .
Bitcoin World 2026-04-22 08:00
Coinbase’s quantum advisory board says quantum computing isn’t yet a threat, but has urged for upgrade work to begin, with some blockchains being less prepared than others.
Cointelegraph 2026-04-22 07:57
BitcoinWorld GBP/JPY Forecast: Bullish Momentum Holds Firm Below Critical 215.00 Level as UK CPI Looms LONDON, March 11, 2025 – The GBP/JPY currency pair maintains a distinctly bullish technical posture, consolidating below the pivotal mid-215.00s resistance zone. This consolidation occurs ahead of a high-stakes UK Consumer Price Index (CPI) report, an event poised to dictate near-term directional momentum for the Sterling-Yen cross. Market participants globally are scrutinizing every price fluctuation, balancing technical chart patterns against fundamental macroeconomic forces. GBP/JPY Technical Analysis: Deciphering the Chart Patterns Technical analysis reveals a compelling narrative for the GBP/JPY pair. The price action has consistently found dynamic support along a rising trendline established from the late-February lows. Furthermore, the pair trades firmly above its key moving averages. The 50-day and 200-day Simple Moving Averages (SMAs) currently act as layered support, reinforcing the underlying bullish structure. However, repeated tests of the resistance area between 215.20 and 215.50 have, so far, capped upward breaks. This creates a clear technical battleground. A decisive daily close above 215.50 would signal a breakout, potentially opening a path toward the next psychological hurdle near 217.00. Conversely, a failure to hold above the 214.00 support cluster could trigger a deeper retracement. Key momentum oscillators like the Relative Strength Index (RSI) currently hover in neutral territory, indicating room for movement in either direction pending a fundamental catalyst. Key Technical Levels for GBP/JPY Traders Traders are closely monitoring several defined price zones derived from recent chart action. Immediate Resistance: 215.20 – 215.50 (Weekly High/Consolidation Zone) Major Resistance: 217.00 (Previous Swing High & Psychological Level) Immediate Support: 214.00 – 214.30 (Confluence of 50-day SMA & Prior Lows) Major Support: 212.50 (200-day SMA & Trendline Support) The Fundamental Catalyst: UK Inflation Data Takes Center Stage The immediate fundamental focus rests entirely on the upcoming UK inflation report. The Bank of England’s (BoE) monetary policy trajectory remains acutely sensitive to price growth data. Consequently, market expectations for the CPI print directly influence Sterling valuation. A headline or core inflation reading that surprises to the upside would likely bolster the British Pound. This scenario would reinforce expectations of a more hawkish BoE, potentially delaying interest rate cuts and providing fuel for a GBP/JPY breakout. Conversely, a softer-than-expected inflation figure could severely undermine the Sterling. It would increase market bets on imminent BoE easing, diminishing the currency’s yield appeal. For the GBP/JPY pair, this could precipitate a rejection from the key resistance zone and a test of lower supports. The interplay between this high-impact data release and the established technical resistance creates a classic volatility setup. Bank of Japan Policy: The Other Side of the Equation While the UK CPI dominates headlines, the Japanese Yen’s trajectory remains a critical component. The Bank of Japan (BoJ) continues its gradual normalization path away from ultra-accommodative policy. However, its pace remains measured compared to other major central banks. Any shift in rhetoric from BoJ officials regarding the timing of further rate hikes or a reduction in bond purchases can cause significant Yen volatility. A more hawkish tilt from Tokyo could strengthen the JPY, acting as a headwind for GBP/JPY gains even if Sterling finds support from UK data. Market analysts often reference the interest rate differential between the UK and Japan as a primary long-term driver. This differential, which favors Sterling, provides a structural tailwind for the pair. Nevertheless, short-term price action frequently reacts to risk sentiment. The JPY traditionally acts as a safe-haven currency. Therefore, a sudden downturn in global equity markets or a spike in geopolitical tension could trigger Yen buying, pressuring GBP/JPY irrespective of UK-specific factors. Expert Insight: Navigating the Crosscurrents Senior analysts at major financial institutions emphasize a balanced approach. “The technical setup for GBP/JPY is unequivocally constructive,” notes a lead strategist from a global investment bank, referencing internal research. “However, the pair sits at a fundamental inflection point. The UK CPI print is not just another data point; it’s a potential regime shifter for BoE expectations. Traders should prioritize managing event risk over chasing breakout narratives prematurely.” This perspective underscores the need for robust risk management, especially around high-volatility economic releases. Market Sentiment and Positioning Data Commitment of Traders (COT) reports and proprietary bank flow data provide additional context. Recent data indicates that speculative positioning on Sterling has turned less bearish in recent weeks, though not excessively long. This suggests there is potential for significant short-covering rallies if bullish catalysts emerge. Regarding the Yen, positioning remains mixed, reflecting the uncertainty around the BoJ’s next policy move. This sentiment backdrop means the market is not overly crowded in one direction, allowing for cleaner momentum moves following definitive news. The broader macroeconomic timeline also informs the outlook. Key events following the UK CPI include the Federal Reserve’s policy decision and subsequent press conference. While not directly linked, shifts in global risk appetite and the US Dollar’s strength can create indirect spillover effects into all major currency pairs, including GBP/JPY. Traders must therefore monitor a complex web of intermarket relationships. Conclusion The GBP/JPY forecast hinges on the imminent clash between a resilient bullish technical structure and a high-stakes fundamental event. The pair’s ability to hold gains below the critical mid-215.00s resistance demonstrates underlying strength, but a conclusive move requires a catalyst. The UK Consumer Price Index report provides exactly that. A strong print could be the key that unlocks a sustained move higher, while a weak one may validate the resistance and trigger a corrective phase. Ultimately, the path for the Sterling-Yen cross will be dictated by the hard data, making disciplined trade execution around the release paramount for market participants. FAQs Q1: What is the most important technical level for GBP/JPY right now? The most critical technical level is the resistance zone between 215.20 and 215.50. A sustained break above this area is necessary to confirm the next leg of the bullish trend. Q2: How does UK CPI data directly affect the GBP/JPY exchange rate? Higher-than-expected UK inflation strengthens expectations that the Bank of England will keep interest rates higher for longer. This typically boosts the British Pound (GBP) against other currencies, including the Japanese Yen (JPY), causing GBP/JPY to rise. Q3: Why is the Bank of Japan’s policy relevant to this currency pair? The Bank of Japan’s policy decisions influence the value of the Japanese Yen. If the BoJ signals a faster pace of policy tightening, it could strengthen the JPY, which would put downward pressure on the GBP/JPY pair, offsetting potential Sterling strength. Q4: What does a “bullish bias” mean in this context? A “bullish bias” means the overall technical and momentum indicators suggest the price is more likely to move upward than downward in the medium term, despite current consolidation or minor pullbacks. Q5: What should a trader watch besides the UK CPI for GBP/JPY direction? Traders should also monitor general risk sentiment in global markets (as JPY is a safe-haven), comments from Bank of Japan officials, broader US Dollar trends, and key support levels around 214.00 on the charts. This post GBP/JPY Forecast: Bullish Momentum Holds Firm Below Critical 215.00 Level as UK CPI Looms first appeared on BitcoinWorld .
Bitcoin World 2026-04-22 07:55
 Dogecoin (DOGE) Needs $0.10 Break Or Faces Fresh Downside Move